Two Homes, One Lot Size, $305,100 Apart: What Long Beach Price Per Square Foot Actually Measures
August 20, 2026
August 20, 2026
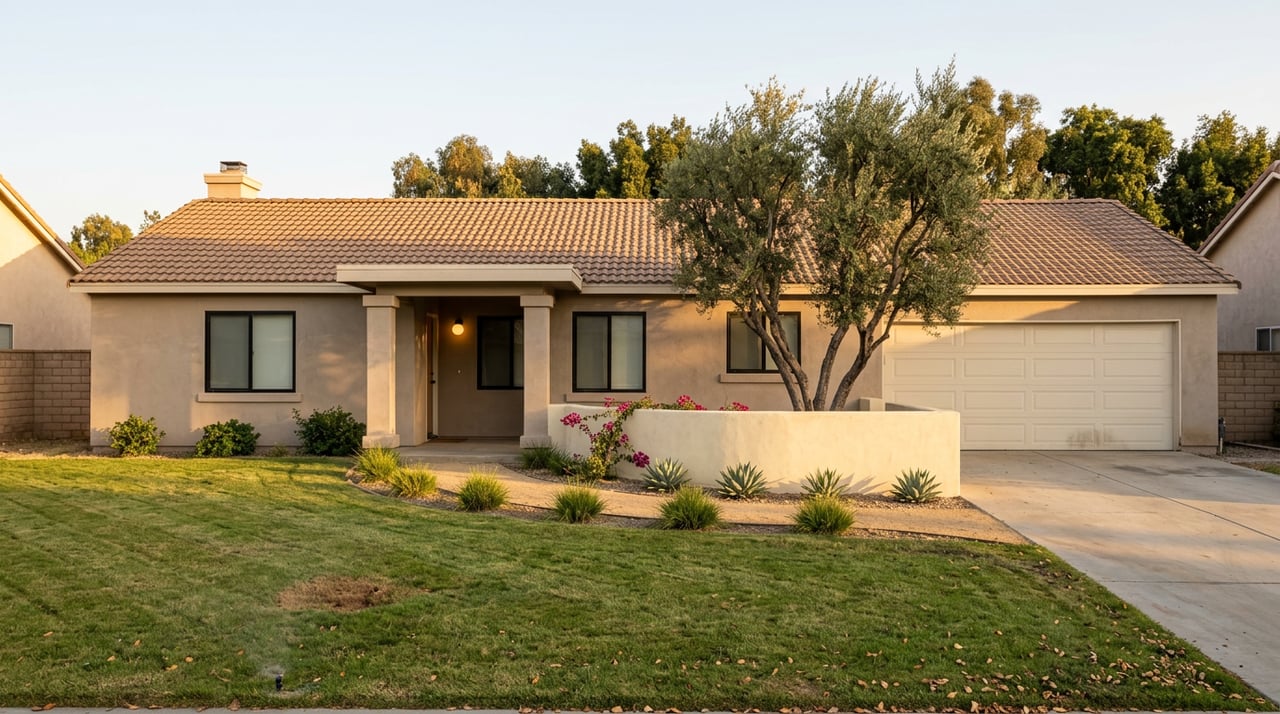
Two houses sat on the market in Long Beach's Bixby Highlands pocket the same week this summer. Same neighborhood. Same lot size, 6,105 square feet. One listed at 2,038 square feet for $684 a foot. The other, smaller at 1,374 square feet, carried a higher per-foot price of $793. The two asking prices are $305,100 apart.
If you shop by price per square foot the way most online tools train you to, the smaller home looks like the worse deal. It costs more per foot. But it also costs less to buy outright, on the exact same dirt. That contradiction is the whole story of what price per square foot means in this city right now, and it's the number most buyers get wrong before they ever call an agent.
Pull up two different home-value sites for Long Beach in the same week and you'll get two different answers to "what's the median home price here." One national estimator puts the citywide list price median just under $700,000 as of August 2026. Another, tracking closed sales over the three months ending in May 2026, puts the median above $875,000. That's a gap of nearly $180,000 for the same city in the same general stretch of the year.
Neither source is wrong. They're measuring different things: list price versus closed sale price, a single current month versus a rolling three-month window. The deeper problem is that a citywide median, whichever version you pick, blends a $585,000 Eastside condo with a $6.85 million double-parcel estate on Naples Island into one number that describes neither. If you're actually comparing a budget to a neighborhood, the citywide figure is close to useless. The pocket-level number is where the real information lives.
Here's the mechanism underneath the Bixby Highlands gap and every other price-per-square-foot swing in this city. When a home's price per square foot is high, you're usually paying for the dirt underneath it, the neighborhood it sits in, or both. When it's low, you're usually paying for finished, livable interior space and the price includes less of a premium for land or location.
The clearest version of this shows up on the Eastside, a broad stretch running roughly from Cherry Avenue toward the Traffic Circle. A top-floor condo at East Park Villas, a gated complex with elevators and a pool just off the Traffic Circle, listed this summer at 1,114 square feet with three bedrooms and two baths for $525 a foot, well under what comparable condos with that bedroom count have been fetching. Meanwhile a single-family lot on Roycroft, in the same broad Eastside area a short drive from Belmont Shore, listed at $962 a foot, the highest per-foot price in that week's entire batch of new listings. The condo buyer is paying for interior square footage and shared amenities. The Roycroft buyer is paying for a 4,594 square foot parcel and the option to build, remodel, or hold. Same neighborhood name. Two completely different products.
Here's how that plays out across a few named pockets, based on listings that hit the market the week of July 31, 2026:
| Size | Price Per Sq Ft | What You're Actually Buying | |
|---|---|---|---|
| East Park Villas condo, near Eastside Traffic Circle | 1,114 sq ft | $525 | Interior space, HOA-covered water and trash, shared amenities |
| Roycroft, Eastside | 4,594 sq ft lot | $962 | Land and location, short drive to Belmont Shore |
| El Dorado Park South | 2,649 sq ft home / 4,864 sq ft lot | $551 | Walkability to schools and parks, freeway proximity |
| Imperial Estates, 90808 | 7,722 sq ft lot | $624 | Wide 1960s ranch lot, strong freeway access |
| Bixby Highlands (larger home) | 2,038 sq ft / 6,105 sq ft lot | $684 | More livable square footage on a fixed lot |
| Bixby Highlands (smaller home, same lot size) | 1,374 sq ft / 6,105 sq ft lot | $793 | Same land value, less interior to spread it across |
Read down that column of per-foot prices and it looks random. Read it as land versus finish and it snaps into focus.
Go back to those two Bixby Highlands homes, because the math there is the cleanest illustration of the mechanism at work. Both sit on identical 6,105 square foot lots in the same established pocket of the 90807, one of the quieter corners of the broader Bixby Knolls area. The land value is fixed. It's the same for both properties. What changes is how much interior space that fixed land value gets divided across.
The larger home, at 2,038 square feet, spreads that land cost across more livable space, which pulls its per-foot price down to $684. The smaller home, at 1,374 square feet, has to divide the same underlying land value across less interior, which pushes its per-foot price up to $793. The per-foot number isn't telling you which home is the better value. It's telling you how much of the price is fixed land cost versus flexible interior cost, and that ratio shifts every time the square footage changes even slightly.
For a buyer choosing between them, the real question isn't which one has the lower price per foot. It's whether the extra 664 square feet, and whatever that space is (bedrooms, a family room, a bigger garage), is worth $305,100 to you specifically. That's a personal budget question, not a market-value question, and no per-square-foot ranking answers it for you.
Not every pocket where per-foot pricing looks low is a warning sign. A three-bedroom, three-bath home in El Dorado Park South listed this summer at 2,649 square feet for $551 a foot, priced under where similar-sized homes have been trading nearby. The lot, at 4,864 square feet, is tight by Eastside standards. What the lower per-foot price doesn't capture is the walk to Kettering Elementary and Channel View Park, or the quick access to the 22, 405, and 605 freeway interchange that makes this pocket a practical daily-commute location rather than a land-banking play.
This is the flip side of the Bixby Highlands lesson. A lower price per square foot here isn't a discount on quality. It's a reflection of what the market is pricing in and what it isn't. Freeway access and school walkability show up in resale speed and buyer interest, not necessarily in the per-foot number itself.
Imperial Estates, over in the 90808, tells a similar story from the land side. A four-bedroom on a 7,722 square foot lot, one of the largest in that week's new listings, priced at $624 a foot. That's a wide 1960s ranch lot with strong freeway access near the 405 and 605, and the lot size is doing real work in that price even though the per-foot number sits in the middle of the pack.
If you're comparing homes across Long Beach pockets, the per-square-foot number is a diagnostic tool, not a leaderboard. Before you rule a listing in or out based on that figure alone, ask:
None of these questions have a universal right answer. They depend on what you're actually trying to buy: a place to live day to day, or land you can build on later. The Legislative Analyst's Office found that only about 22 percent of California households could likely qualify for a mortgage on a mid-tier home in 2026, which is exactly why getting this math right on the first pass matters more than it used to. There's less room to guess wrong and try again next year.
FAQ
Does a lower price per square foot always mean a better deal? No. It usually means less of the price is tied to land value and more is tied to interior square footage. Whether that's a better deal depends on whether you value space or land more for your situation.
Why do different sites show different median home prices for Long Beach? They measure different things. Some track list prices, others track closed sales. Some use a single month, others a rolling three-month window. All of them blend property types and pockets that don't behave the same way, which is why a citywide median rarely matches what a specific neighborhood is actually doing.
Should I compare price per square foot across different Long Beach neighborhoods? Only as a starting point. It's more useful to compare it within a single pocket, where lot sizes and land values are closer to consistent, than to use it as a ranking tool across the whole city.
If you're trying to figure out what a specific budget actually buys in a specific Long Beach pocket, that's a conversation worth having before you start touring homes, not after. Celeste Castillo works these Southeast Los Angeles and Long Beach submarkets block by block, and can walk you through what a given price per square foot is really telling you in the neighborhood you're considering. Get your instant home valuation to see where your own numbers stand today.
Stay up to date on the latest real estate trends.


Backed by years of success and experience, I’m here to deliver results that exceed your expectations. Contact Celeste today to navigate the journey of buying or selling with confidence.